Coursework
The class notebooks behind my projects. Each card links to the full notebook with code and output, so you can see how I work.
A note on what's what: notebooks marked In-class are exercises I coded during lectures following my professor's walkthrough. Homework and finals are my own independent work. The Predictive Analytics notebooks follow my professor's lecture notes, which I typed and ran during class; they're shared here with his permission. My featured projects are on the Portfolio page.
Data Visualization
CSUN · Python, matplotlib, seaborn, networkx, GeoPandas
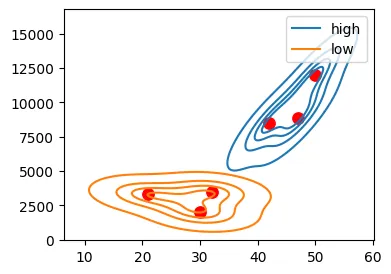
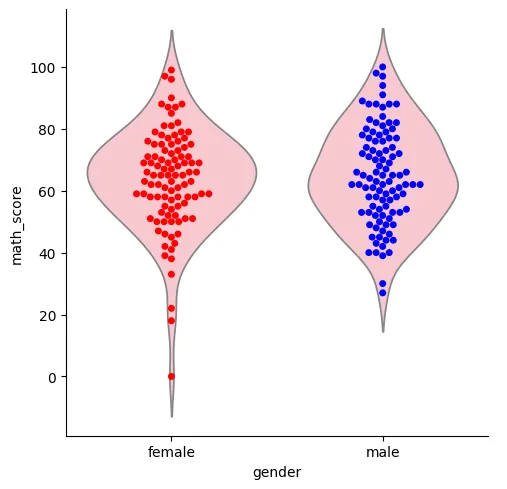
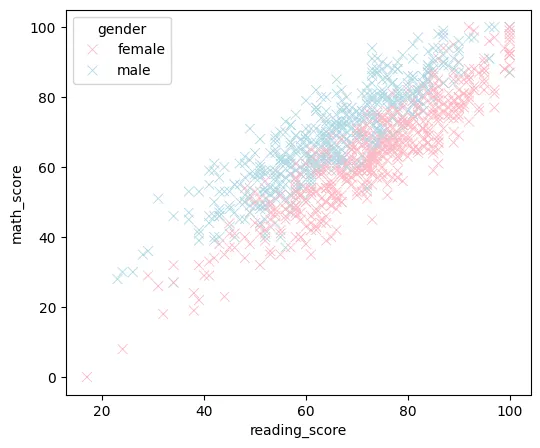
Distributions & comparisons
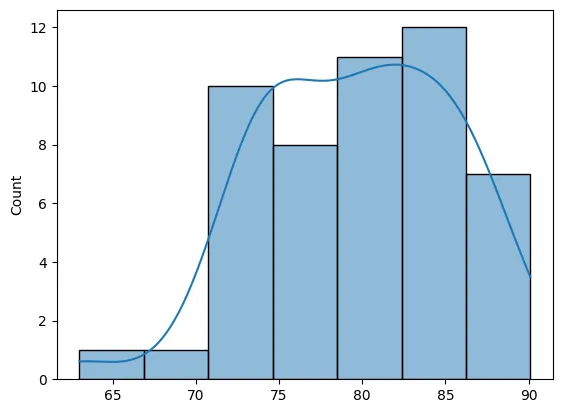
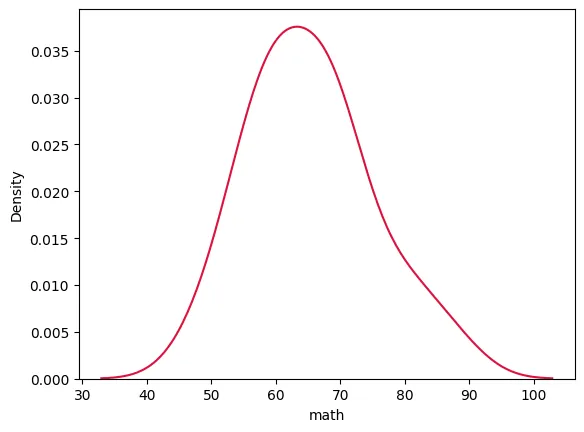
Histograms, KDE and box plots to compare score distributions across groups, including separating groups with independent normalization.
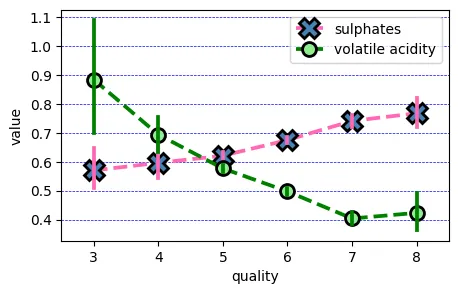
Central tendency & variance
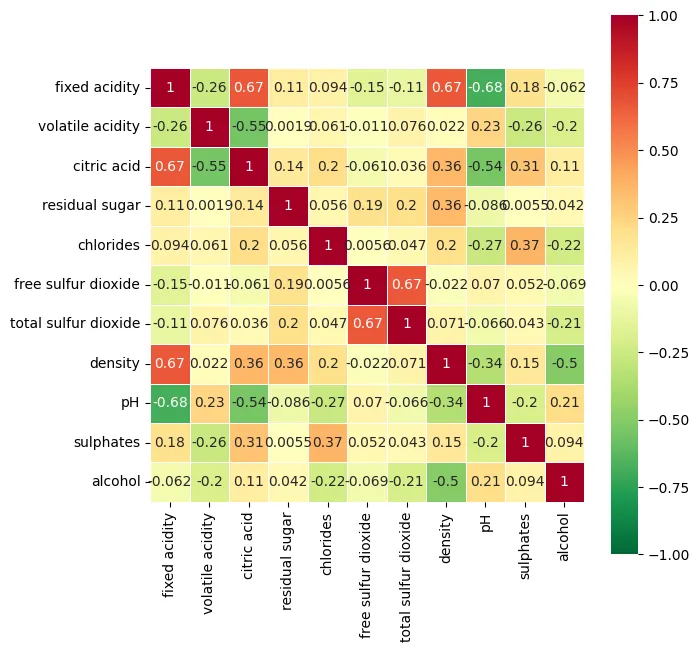
Point plots with error bars to compare averages and spread of wine chemistry across quality levels.
Time series
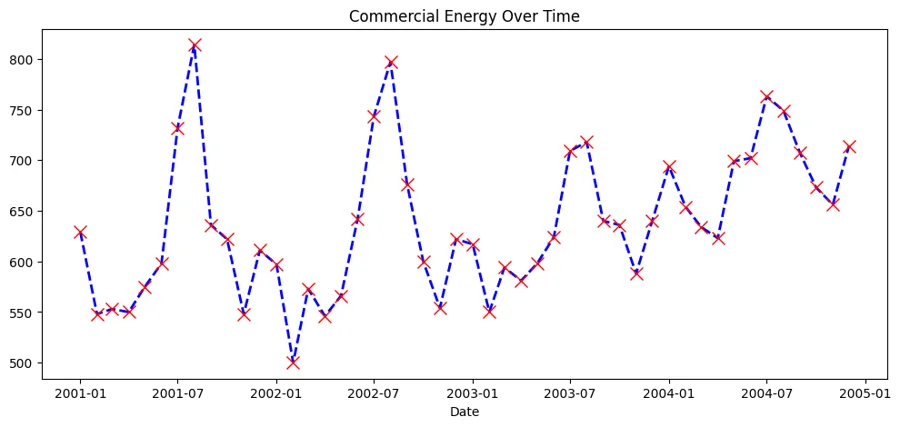
Line charts of gold prices and U.S. commercial vs. industrial energy generation over time, plus custom function curves.
Exploratory analysis: mushrooms
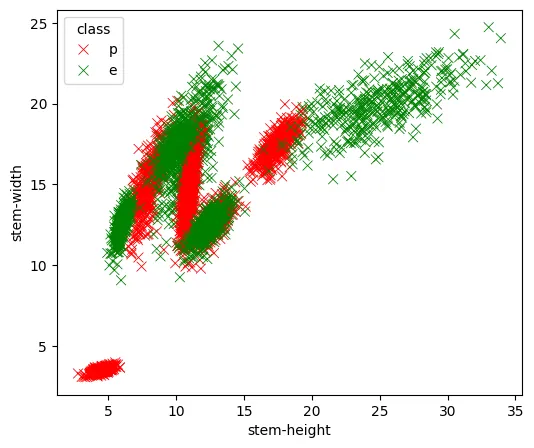
A full visual EDA: how stem height and width relate, how edible and poisonous mushrooms differ, and how traits shift by season.
Customer insights
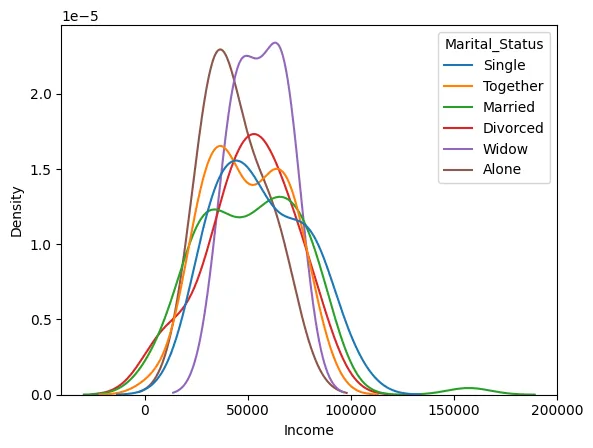
Answering business questions about store customers: education mix, and whether the number of kids at home relates to income.
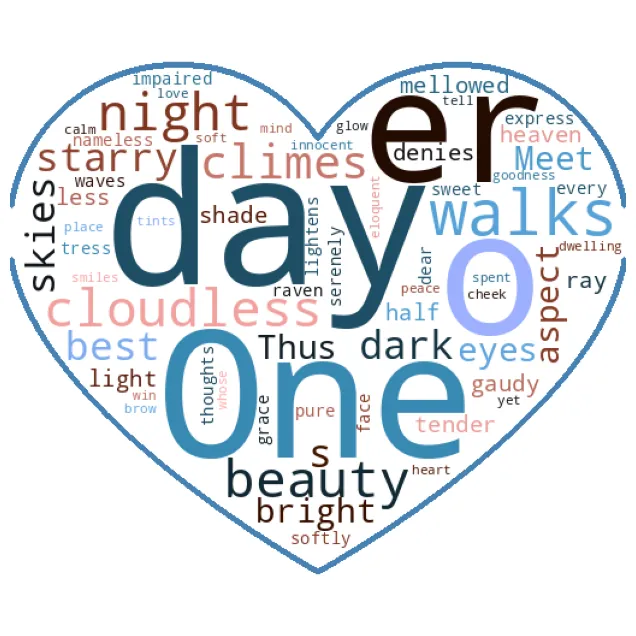
Text visualization
Word clouds with stop-word filtering, including a custom shape mask built from an image.
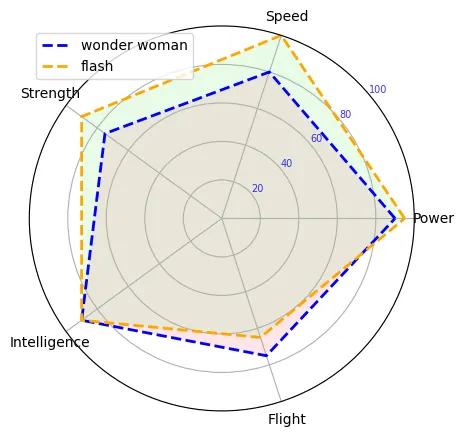
Radar charts
Polar radar charts to compare a profile across many attributes at once.
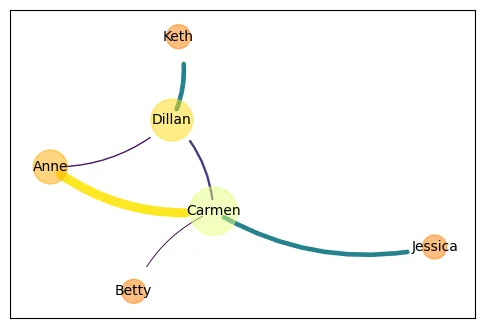
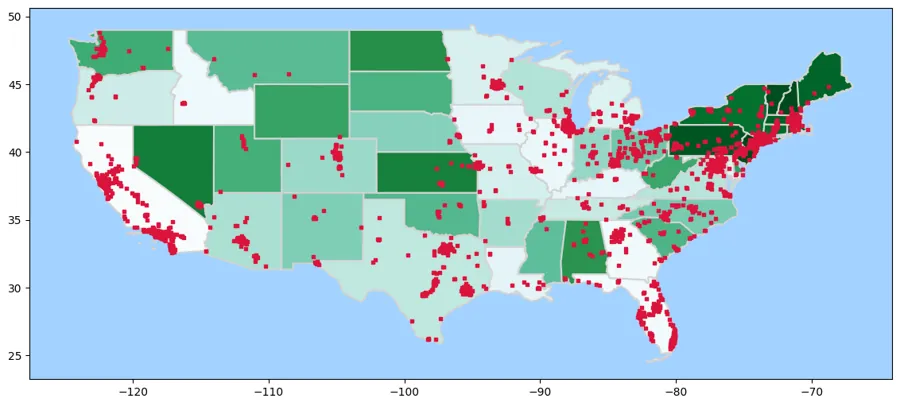
Modeling seasonal demand
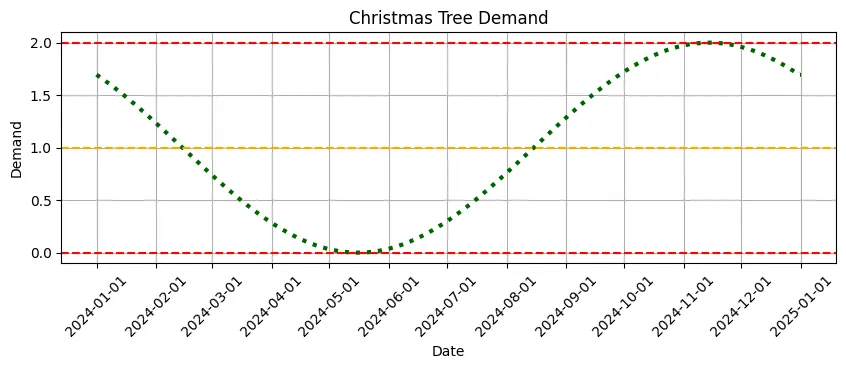
Using sine waves to model seasonal demand, like Christmas tree sales, with adjustable baseline, amplitude and phase.
Homework & practice sets
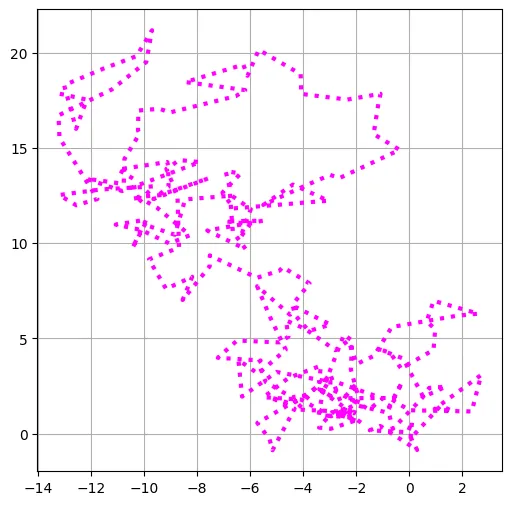
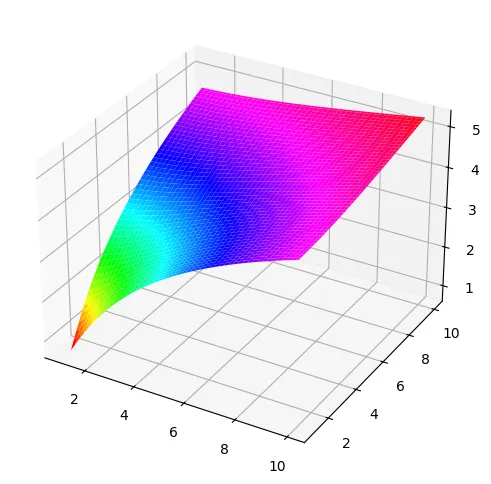
Independent homework: sales distributions, TV vs. radio ad spend, and customer and energy analyses with written findings.
Predictive Analytics
CSUN · Python, pandas, scikit-learn, SciPy
Python foundations
Variables, arithmetic, lists, control flow and functions, then building pandas DataFrames: the building blocks for everything that follows.
Data understanding
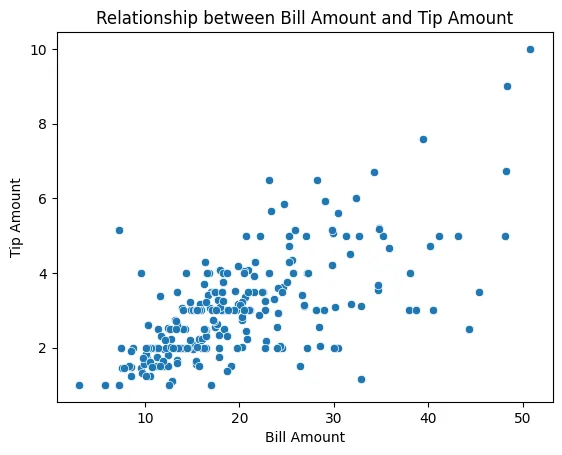
Profiling a restaurant tips dataset with histograms, bar and line charts, cross-tabulations, and a chi-square test of whether smoking and sex are related.
Hypothesis testing
Checking for missing values and running t-tests to decide whether differences between groups are statistically significant.
Data preparation
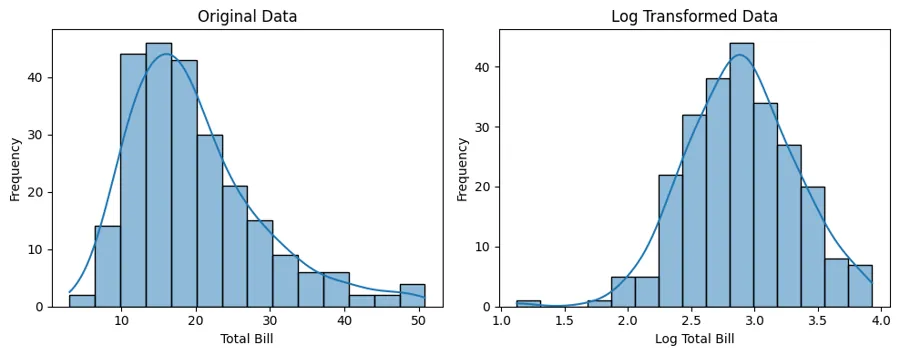
Cleaning real data: removing and imputing missing values, finding outliers with z-scores and box plots, and standardizing King County home prices.
Preprocessing, feature selection & evaluation
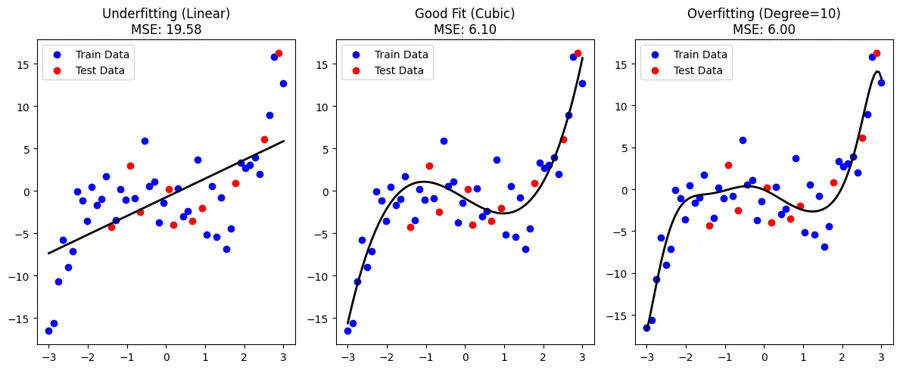
Mean, KNN and MICE imputation, encoding, scaling, forward and backward feature selection, ridge and lasso regularization, ROC curves (AUC 0.92) and k-fold cross-validation.
Classification: credit card default
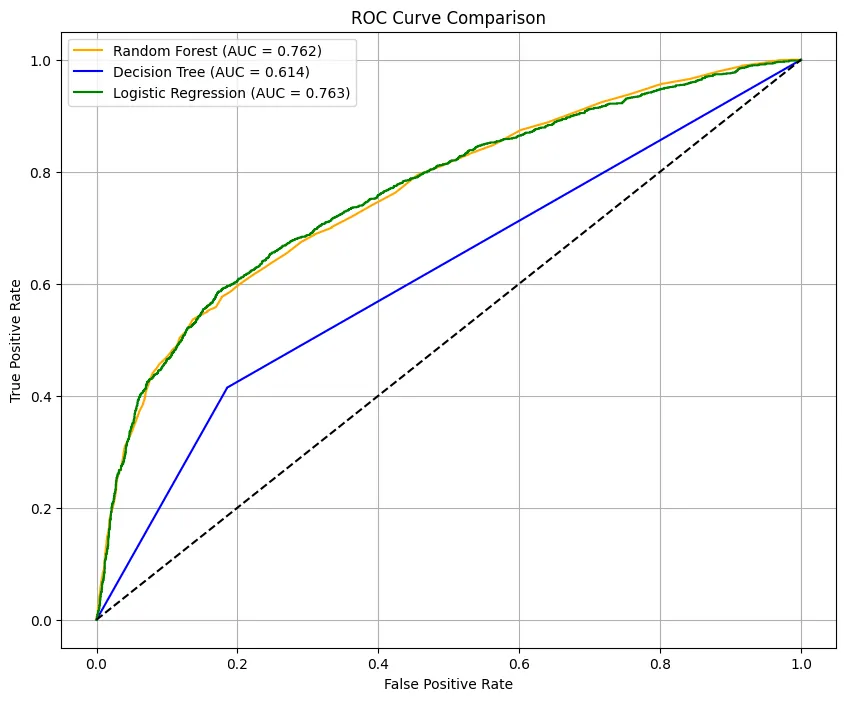
Predicting credit card default with random forest, decision tree and logistic regression. Random forest and logistic regression reached about 82% test accuracy; the decision tree scored nearly 100% on training data but 73% on test data, a clear case of overfitting.
Clustering
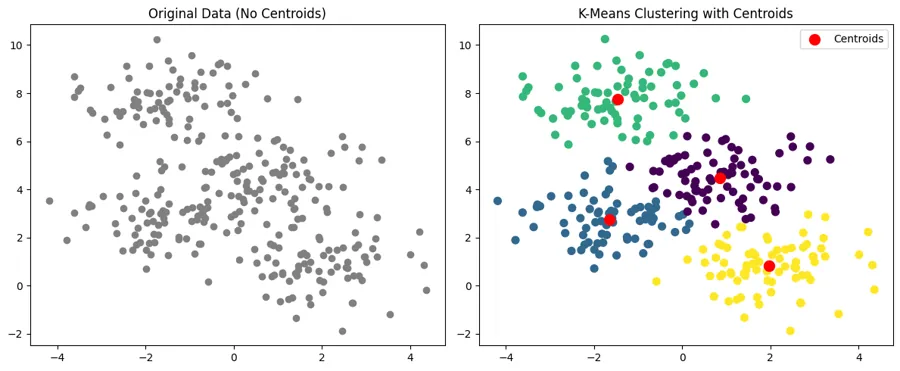
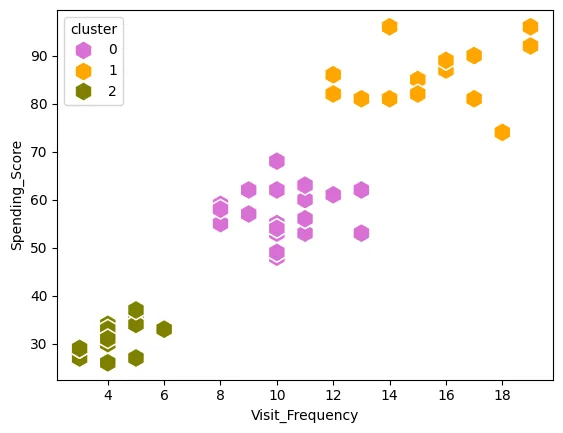
Unsupervised learning with k-means (with centroids plotted) and agglomerative clustering visualized as a dendrogram.
Machine Learning
CSUN · Python, scikit-learn, mlxtend, PyTorch
Data preprocessing
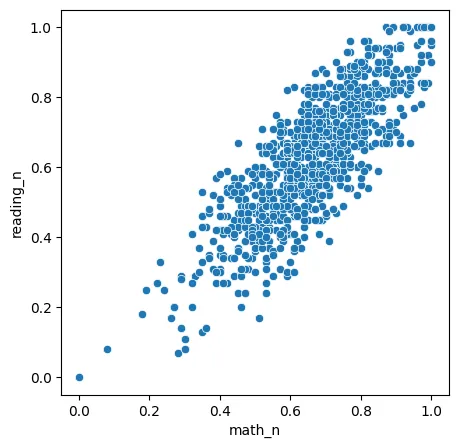
Min-max and z-score normalization, dummy variables, and splitting numeric and categorical features so data is ready for machine learning.
Naive Bayes
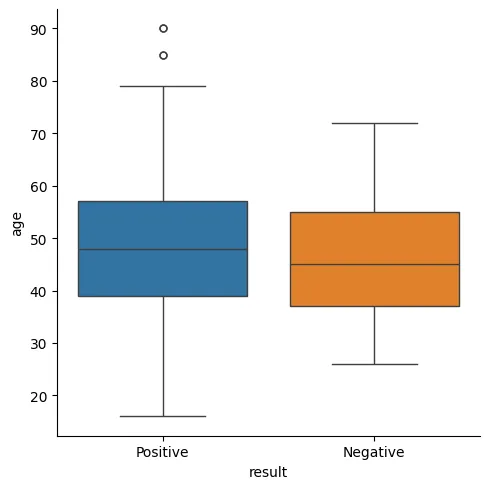
A multinomial Naive Bayes classifier for diabetes risk from patient symptoms, with dummy-encoded features.
Model evaluation
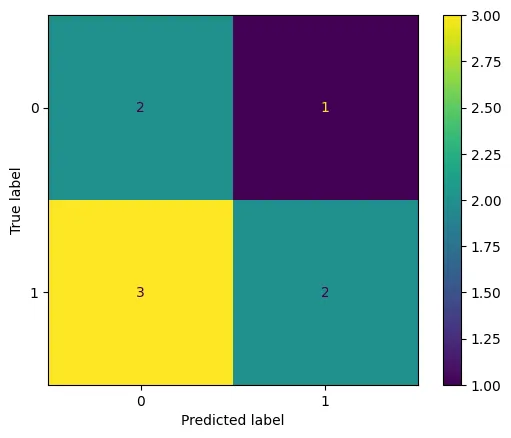
Precision, recall, F1 and support worked out by hand, then checked against scikit-learn's classification report and confusion matrix.
Neural networks
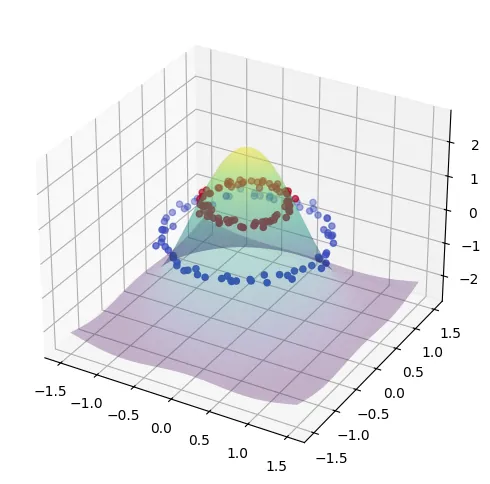
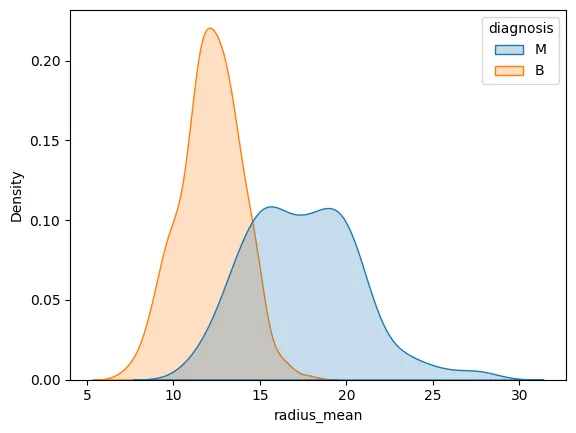
A multilayer perceptron that classified breast-cancer tumors as benign or malignant with 87% accuracy after standardizing features.
Deep learning with PyTorch
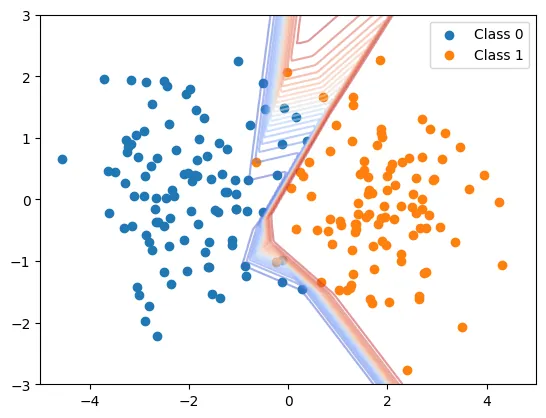
Tensors, a small neural network trained with gradient descent (loss falling from 0.73 to 0.04) and its learned decision boundary.