Overview
A wine company wanted to replace one-size-fits-all marketing with campaigns tailored to how different customers buy. I grouped customers by purchase behavior and mapped what each group buys and when.
Key results
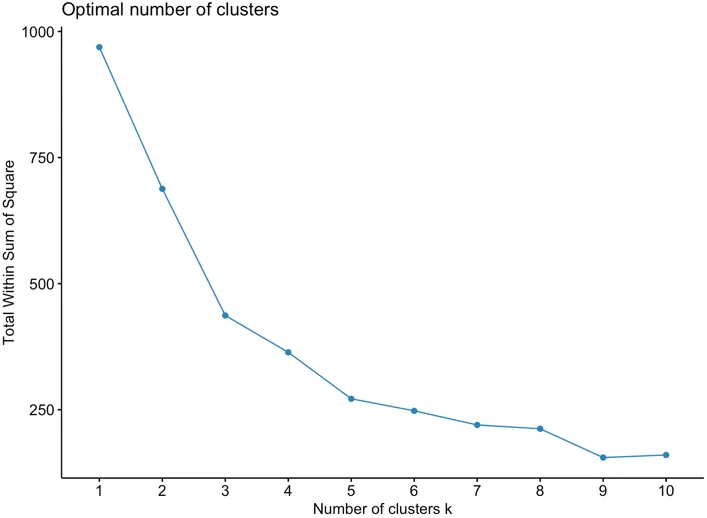
3customer segments, chosen with the elbow method
3 methodscompared to pick k: elbow (3), silhouette (9), gap statistic (7)
The question
Which customers behave alike, so marketing dollars can be aimed at the right group at the right time?
What I did
- Removed nulls, kept numeric features only and scaled the data
- Calculated distances and built a dendrogram
- Compared the elbow, silhouette and gap-statistic methods to choose the number of clusters
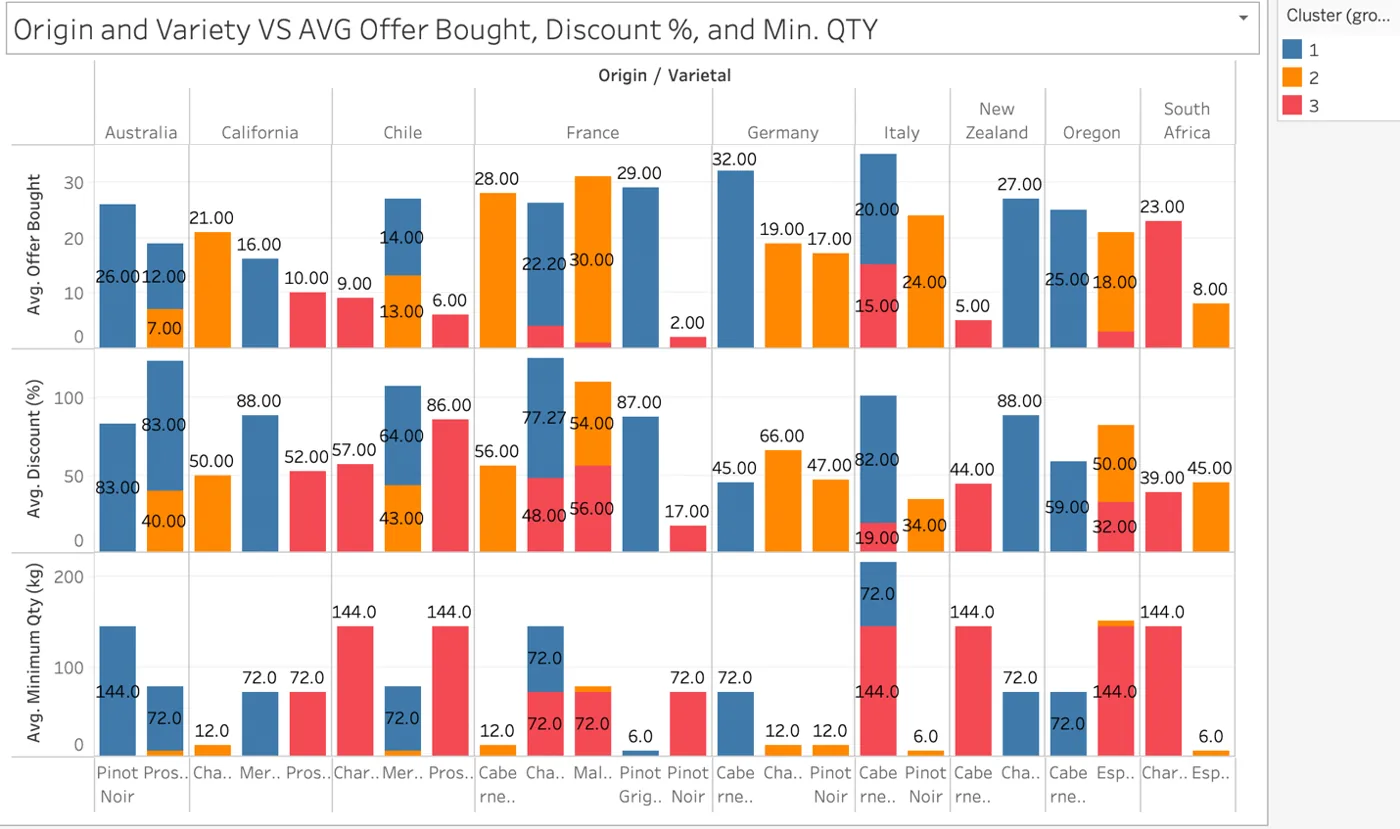
- Exported cluster labels to Tableau to map each segment's buying months, origin and wine type
What I found
Each segment buys in a different part of the year: one group shops only in the first months, another starts in March. Campaigns can be timed and themed per group instead of sent to everyone at once.
The Code
The actual R I wrote for this project. Scroll inside the window to read it all.
install.packages("tidyverse")
install.packages("cluster")
install.packages("factoextra")

library(tidyverse)
library(cluster)
library(factoextra)

#data
wine <- read.csv("Desktop/WineData.csv", header= TRUE, sep = ",", quote = '"')
wine
############# data prep
#cant have null values, and quantitative values only or it wont work
#also can only have numeric values or characters
str(wine)
view(wine)
summary(wine)

#deselect character values
z <- wine %>% select(-Campaign, -Varietal, -Origin, -Customer.Last.Name)
str(z)

#normalize data
z <- scale(z)
head(z)

############ Distance
#calculate distance
distance <- dist(z)
print(distance)

#cluster dendogream
clust_dend <- hclust(distance)
plot(clust_dend)

# k means clustering
set.seed(200)
k2 <- kmeans(z,centers = 2,nstart = 25)
k2

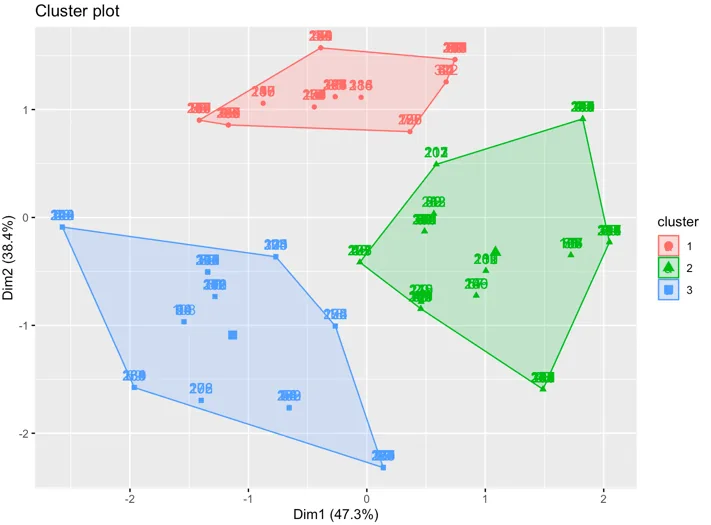
fviz_cluster(k2,data = z)

k3 <- kmeans(z,centers = 3,nstart = 25)
k3

fviz_cluster(k3,data = z)

######## optimize, find the best amount of clusters
#elbow method, where th graph starts to shorten its exponential length, 3 in this case
fviz_nbclust(z,kmeans,method = "wss")

#silhouette method
fviz_nbclust(z,kmeans,method = "silhouette")

#gap stat method
fviz_nbclust(z,kmeans,method = "gap_stat")

#we got 3, 9, 7. but going to use 3 for this example

#model results

clusters <- kmeans(z, centers = 3, nstart = 25)

#create a column that takes in the kmeans model, using the cluster column from the model
wine <- wine %>% mutate(cluster = clusters$cluster)
view(wine)

wine$cluster <- as.factor(wine$cluster)

wine %>% ggplot(aes(x =Minimum.Qty..kg., y =Discount...., color =cluster)) + geom_point()

wine %>% ggplot(aes(x= Varietal,fill= cluster)) + geom_bar()

view(wine$cluster)

list(wine$cluster)