Overview
Our client, Firm 798, was losing revenue in a growing U.S. kitchenware market. We benchmarked it against two competitors using 2015–2017 transaction data, then built a three-part growth plan.
Key results
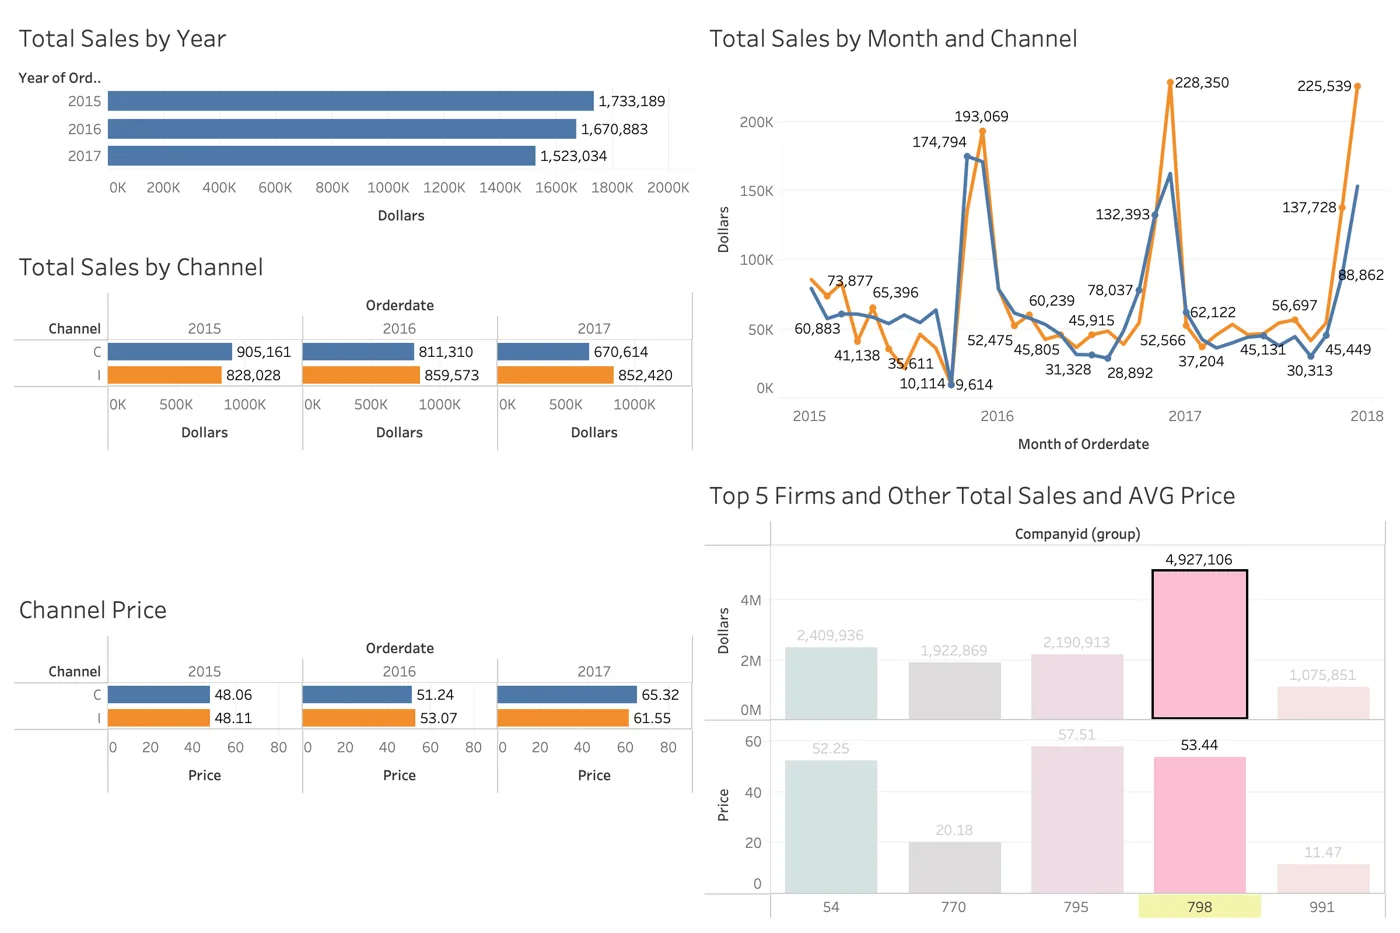
–$210Kclient revenue decline, from $1.73M (2015) to $1.52M (2017)
–26%drop in the client's catalog channel, its biggest weakness
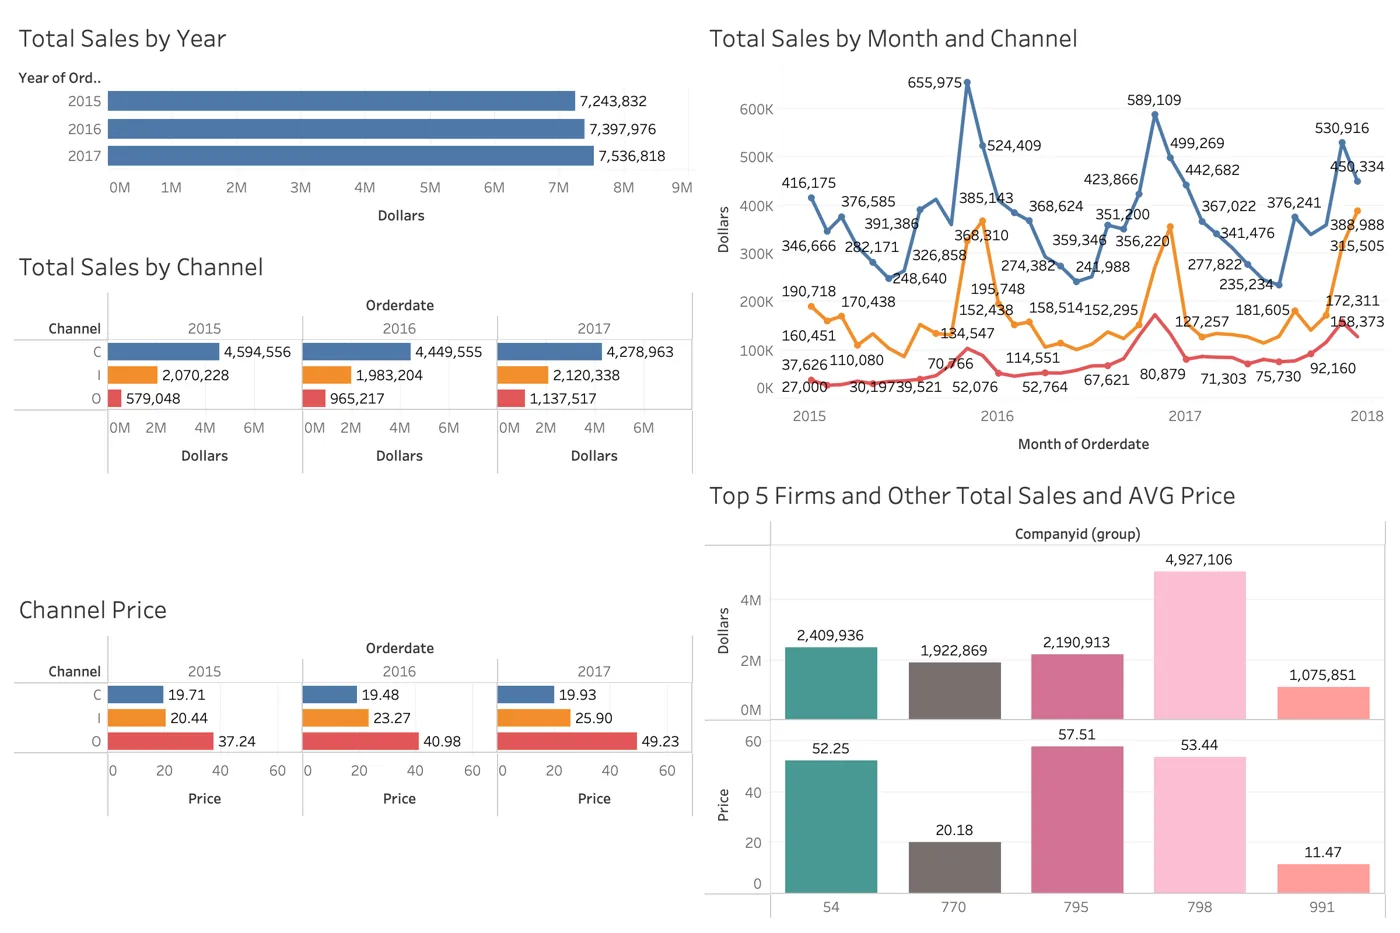
2.3×growth for competitor Firm 54 in the "Other" channel ($464K → $1.09M)
+44%growth for Firm 795 in the same two channels our client uses
The question
Why is Firm 798 shrinking while the market grows, and what can it learn from the two competitors that are succeeding?
What I did
- Built Tableau dashboards comparing channel trends for the market and for each firm
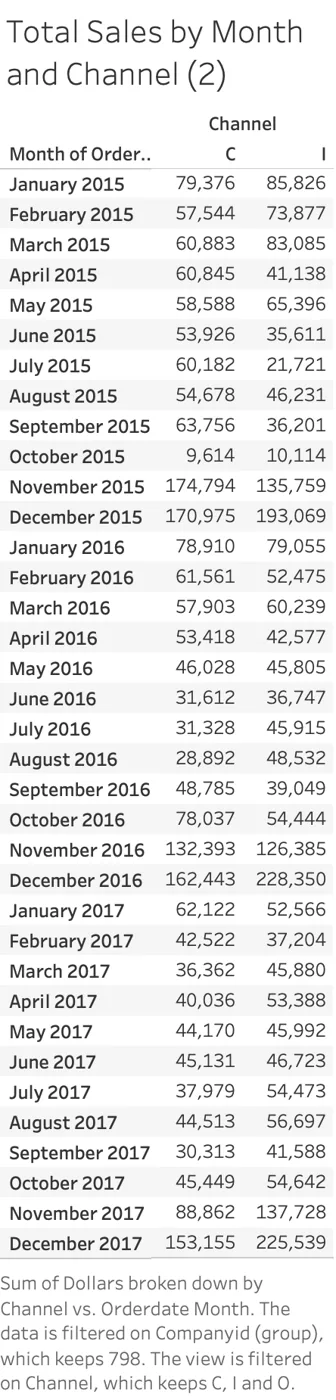
- Analyzed monthly sales to find seasonal peaks (October–December)
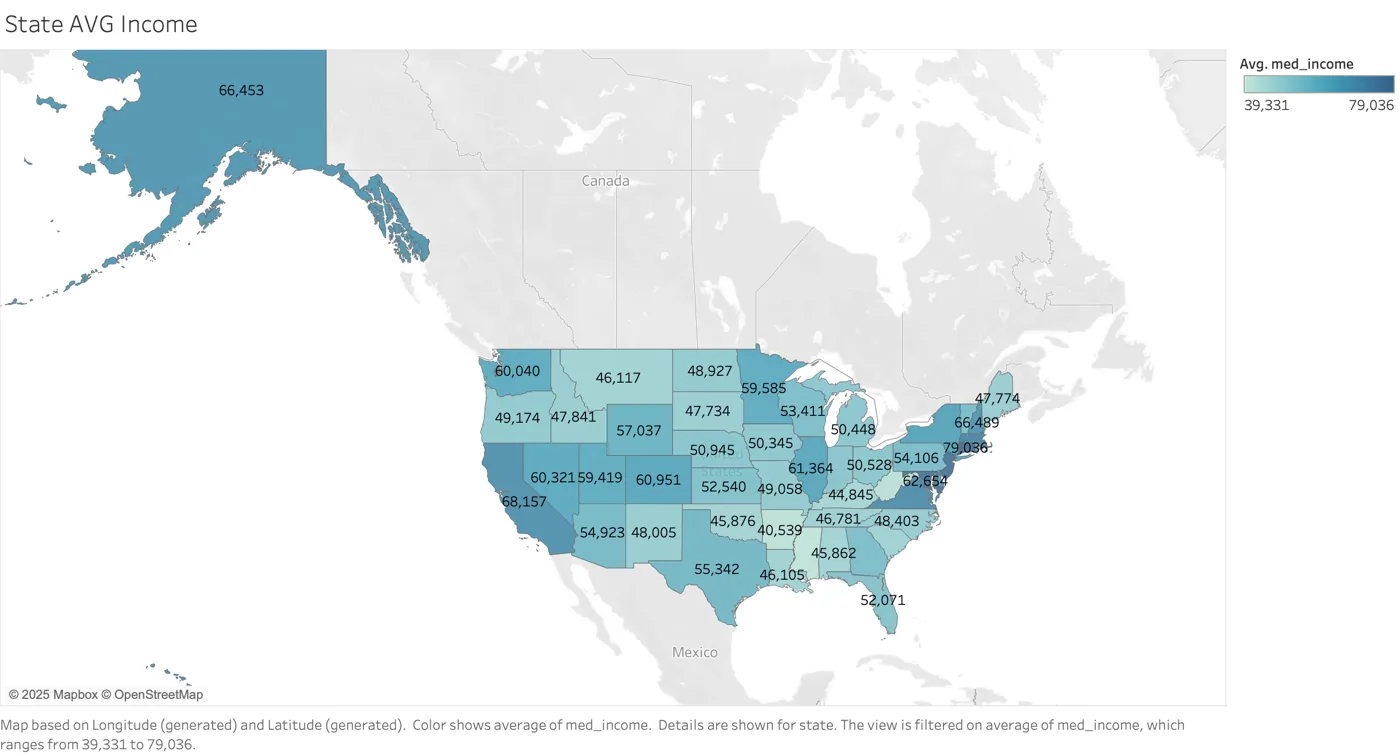
- Matched customer income to state averages to test brand and customer fit
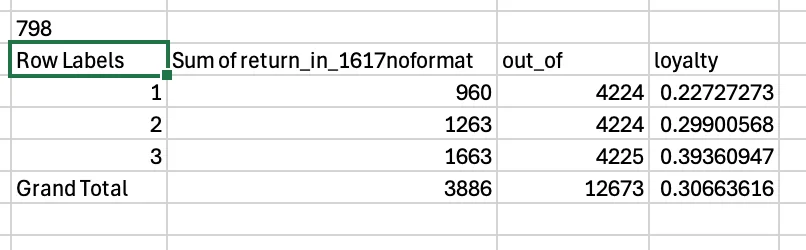
- Ran an RFM analysis to measure customer retention and loyalty
What I found
The client has the wealthiest customers but a dated catalog, weak Q4 execution in that channel, and trouble keeping new buyers. We recommended entering the "Other" channel with a two-tier value strategy, modernizing the online experience around Q4 demand, and redesigning the catalog with digital integration.
The Code
This project was built in Tableau and Excel rather than code: interactive dashboards, calculated fields (like average price = SUM(dollars) / SUM(quantity)), and RFM scoring in spreadsheets. The dashboards are shown in the charts below.