Overview
A medical airlift company asked: if new laws require meal breaks for its on-call flight nurses, how often would it be out of compliance, and what would that do to emergency response times?
Key results
The question
California labor law requires a 30-minute meal break every five hours. These nurses work 24-hour shifts with unpredictable calls. The board wanted to know how often breaks would be interrupted, and what it would cost in response time to protect them.
What I did
- Cleaned call logs: converted timestamps, validated coordinates, handled cancelled calls
- Engineered response, dispatch and call-duration times, plus crew size per call
- Modeled a 3-break shift schedule and flagged every call that overlapped a break
- Used geodesic distance to estimate response times if the nearest other base took the call
What I found
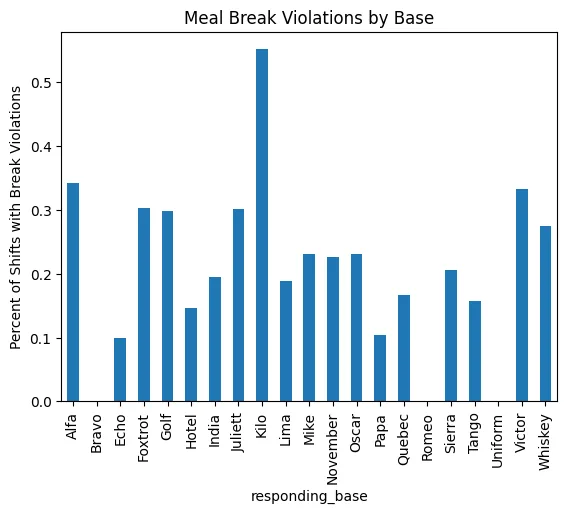
About 31% of shifts would have at least one violation, concentrated at the busiest bases. Rerouting calls during breaks adds about 3.4 minutes on average. We recommended staggered breaks and extra staffing at high-volume bases instead of blanket rerouting.
The Code
The actual Python I wrote for this project. Scroll inside the window to read it all.
import numpy as np
import matplotlib.pyplot as plt
import seaborn as sns
import pandas as pd

#read data
df = pd.read_csv('undergrad-full.csv')
df.head(10)

df.info()

# check out the data type for each column
df.dtypes

#check out whole dataframe and identify which columns have missing values
df.isnull().sum()

df.duplicated().sum()

#corect time columns
time_columns = [
    'call_date',
    'call_started_time',
    'depart_base_time',
    'arrive_patient_location_time',
    'return_to_base_time',
    'call_cancelled_time'
]

for col in time_columns:
    df[col] = pd.to_datetime(df[col])

df.dtypes

#remove extra space if any
df['responding_base'] = df['responding_base'].str.strip()

#make sure long and lang are real coordinates
df = df[(df['pickup_latitude'].between(-90,90)) &
        (df['pickup_longitude'].between(-180,180))]

#new column to record how long it takes to get to the patient
df['response_time_minutes'] = (
    df['arrive_patient_location_time'] - df['call_started_time']
).dt.total_seconds() / 60

#new column to record how long it takes to send responders out after getting a call
df['dispatch_time_minutes'] = (
    df['depart_base_time'] - df['call_started_time']
).dt.total_seconds() / 60

#number of nurses needed per call
df['num_responding_nurses'] = df[
['responding_nurse1','responding_nurse2','responding_nurse3']
].notnull().sum(axis=1)

df.head(10)

#check average response time to the patient per base
df.groupby('responding_base')['response_time_minutes'].mean()

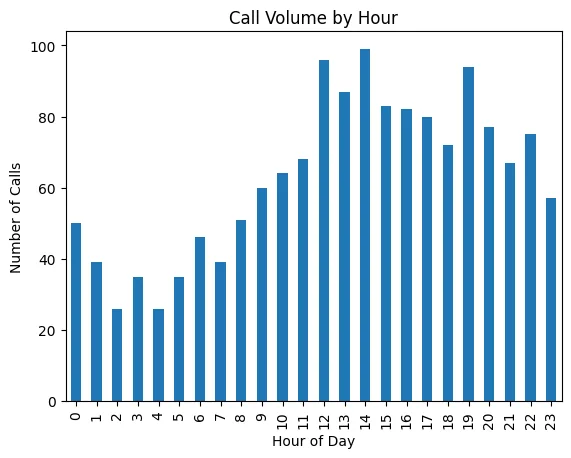
#when calls occur the most
df['call_hour'] = df['call_started_time'].dt.hour

df['call_hour'].value_counts().sort_index()

#visualize
df['call_hour'].value_counts().sort_index().plot(kind='bar')
plt.xlabel("Hour of Day")
plt.ylabel("Number of Calls")
plt.title("Call Volume by Hour")
plt.show()

#by base
df.groupby('responding_base')['response_time_minutes'].mean()

#which base has the most calls
df['responding_base'].value_counts()

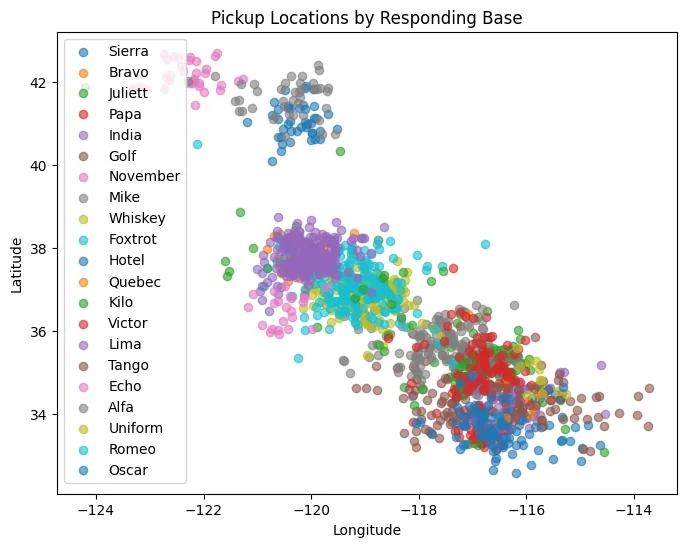
#visual of respond zones of each base, but need geo py to map US. going to use tableau for this
plt.figure(figsize=(8,6))

for base in df['responding_base'].unique():
    subset = df[df['responding_base'] == base]
    plt.scatter(
        subset['pickup_longitude'],
        subset['pickup_latitude'],
        label=base,
        alpha=0.6
    )

plt.xlabel("Longitude")
plt.ylabel("Latitude")
plt.title("Pickup Locations by Responding Base")
plt.legend()
plt.show()

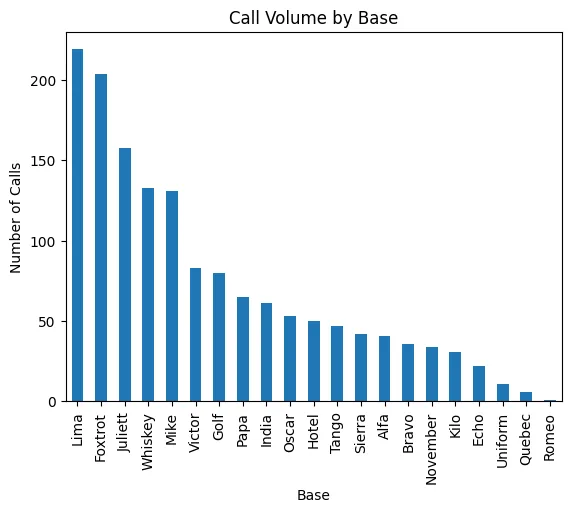
#3 which bases are the buisest
df['responding_base'].value_counts()

#visualize call volume by base

df['responding_base'].value_counts().plot(kind='bar')
plt.title("Call Volume by Base")
plt.xlabel("Base")
plt.ylabel("Number of Calls")
plt.show()

#new column for total call time
df['call_duration_minutes'] = (
    df['return_to_base_time'] - df['depart_base_time']
).dt.total_seconds() / 60

#total call time per base
df.groupby('responding_base')['call_duration_minutes'].sum()

busy_time = df.groupby('responding_base')['call_duration_minutes'].sum()

shift_minutes = 1440
busy_percentage = (busy_time / shift_minutes) * 100

busy_time = df.groupby('responding_base')['call_duration_minutes'].sum()

busy_time.plot(kind='bar')

plt.xlabel("Responding Base")
plt.ylabel("Total Busy Time (Minutes)")
plt.title("Total Nurse Busy Time by Base")
plt.show()

df['call_duration_minutes'].plot(kind='hist', bins=20)

plt.xlabel("Call Duration (Minutes)")
plt.title("Distribution of Call Duration")
plt.show()

# nurse shift time
df['shift_start'] = df.groupby(['responding_base','call_date'])['call_started_time'].transform('min')

#calculate breaks
#break 1
df['break1_start'] = df['shift_start'] + pd.Timedelta(hours=4.5)
df['break1_end'] = df['shift_start'] + pd.Timedelta(hours=5)

#break 2
df['break2_start'] = df['shift_start'] + pd.Timedelta(hours=9.5)
df['break2_end'] = df['shift_start'] + pd.Timedelta(hours=10)

#break 3
df['break3_start'] = df['shift_start'] + pd.Timedelta(hours=14.5)
df['break3_end'] = df['shift_start'] + pd.Timedelta(hours=15)

#break violations
df['break1_violation'] = (
    (df['depart_base_time'] < df['break1_end']) &
    (df['return_to_base_time'] > df['break1_start'])
)

df['break2_violation'] = (
    (df['depart_base_time'] < df['break2_end']) &
    (df['return_to_base_time'] > df['break2_start'])
)

df['break3_violation'] = (
    (df['depart_base_time'] < df['break3_end']) &
    (df['return_to_base_time'] > df['break3_start'])
)

#which call violated a break
df['any_break_violation'] = (
    df['break1_violation'] |
    df['break2_violation'] |
    df['break3_violation']
)

#average violations overall
df['any_break_violation'].mean() * 100

#average violations per base
df.groupby('responding_base')['any_break_violation'].mean() * 100

#define shifts per base
df['shift_id'] = df['responding_base'].astype(str) + "_" + df['call_date'].astype(str)

#check if a base has a violation
shift_violations = df.groupby('shift_id')['any_break_violation'].any()

#by percent
shift_violation_rate = shift_violations.mean() * 100
print(shift_violation_rate)

#mini data of shifts
shift_df = df[['shift_id','responding_base','any_break_violation']].drop_duplicates()

#average shift violations by base
shift_df.groupby('responding_base')['any_break_violation'].mean() * 100

#visualization
shift_df.groupby('responding_base')['any_break_violation'].mean().plot(kind='bar')

plt.ylabel("Percent of Shifts with Break Violations")
plt.title("Meal Break Violations by Base")
plt.show()

#average pick up location per base
base_locations = df.groupby('responding_base')[['pickup_latitude','pickup_longitude']].mean()

#import library to use geo location
from geopy.distance import geodesic

#drop missing values
df = df.dropna(subset=['pickup_latitude', 'pickup_longitude'])

# Create a table containing the geographic coordinates of each base
base_locations = df.groupby('responding_base')[['base_latitude', 'base_longitude']].first()

# Create a list of all base names to iterate through later
bases = base_locations.index.tolist()

# Define a function that finds the best alternative base for a call
def find_alt_base(row):

  # Define a function that finds the best alternative base for a call
    call_loc = (row['pickup_latitude'], row['pickup_longitude'])

    # Identify which base originally responded to the call
    original_base = row['responding_base']

    # Initialize variables to store the best alternative base, and start with largest distance
    best_base = None
    best_distance = float('inf')
  #look thorugh every base
    for base in bases:

      #skip through original
        if base == original_base:
            continue

        base_lat = base_locations.loc[base, 'base_latitude']
        base_lon = base_locations.loc[base, 'base_longitude']

        # Calculate the geographic distance from the base to the pickup location
        dist = geodesic(call_loc, (base_lat, base_lon)).km

        # If this base is closer than any previously checked base, update the base with shortest distance
        if dist < best_distance:
            best_distance = dist
            best_base = base

    return pd.Series([best_base, best_distance])

# Apply the function to every call in the dataset
df[['alt_base', 'alt_distance_km']] = df.apply(find_alt_base, axis=1)

# Calculate the actual response time for each call in minutes
# This is the observed time from when the call started to when responders arrived
df['response_time_minutes'] = (
    df['arrive_patient_location_time'] - df['call_started_time']
).dt.total_seconds() / 60


# Define a function to calculate the distance from the original assigned base
# to the pickup location of the call
def distance_to_original(row):

    # Get the coordinates of the original responding base
    base_lat = base_locations.loc[row['responding_base'], 'base_latitude']
    base_lon = base_locations.loc[row['responding_base'], 'base_longitude']

    # Calculate and return the geographic distance in kilometers
    return geodesic(
        (row['pickup_latitude'], row['pickup_longitude']),
        (base_lat, base_lon)
    ).km


# Apply the function to every row to get the original base distance
df['orig_distance_km'] = df.apply(distance_to_original, axis=1)


# Remove rows where the original distance is 0 or missing
# This avoids division errors when estimating the new response time
df = df[df['orig_distance_km'] > 0]


# Estimate the new response time if the call were assigned to the closest alternative base
# Assumption: response time changes proportionally with distance
df['new_response_time_minutes'] = (
    df['response_time_minutes'] *
    (df['alt_distance_km'] / df['orig_distance_km'])
)


# Calculate how much the response time changes under reassignment
# Positive values mean the reassigned call would take longer
df['response_time_change'] = (
    df['new_response_time_minutes'] - df['response_time_minutes']
)

# Compare average original and reassigned response times
df[['response_time_minutes', 'new_response_time_minutes']].mean()

# Average increase in response time after reassignment
df['response_time_change'].mean()

example_call = df[
    (df['call_started_time'] == pd.Timestamp('2017-04-26 06:20:00')) &
    (df['responding_base'] == 'Golf')
]

example_call[[
    'call_started_time',
    'responding_base',
    'alt_base',
    'response_time_minutes',
    'new_response_time_minutes',
    'response_time_change'
]]